We make nature legible for the people who decide what gets sourced, built, and restored.
Satellite, biodiversity, water, and forest data — read together by an AI, adapted to your role. No spatial-data team needed.




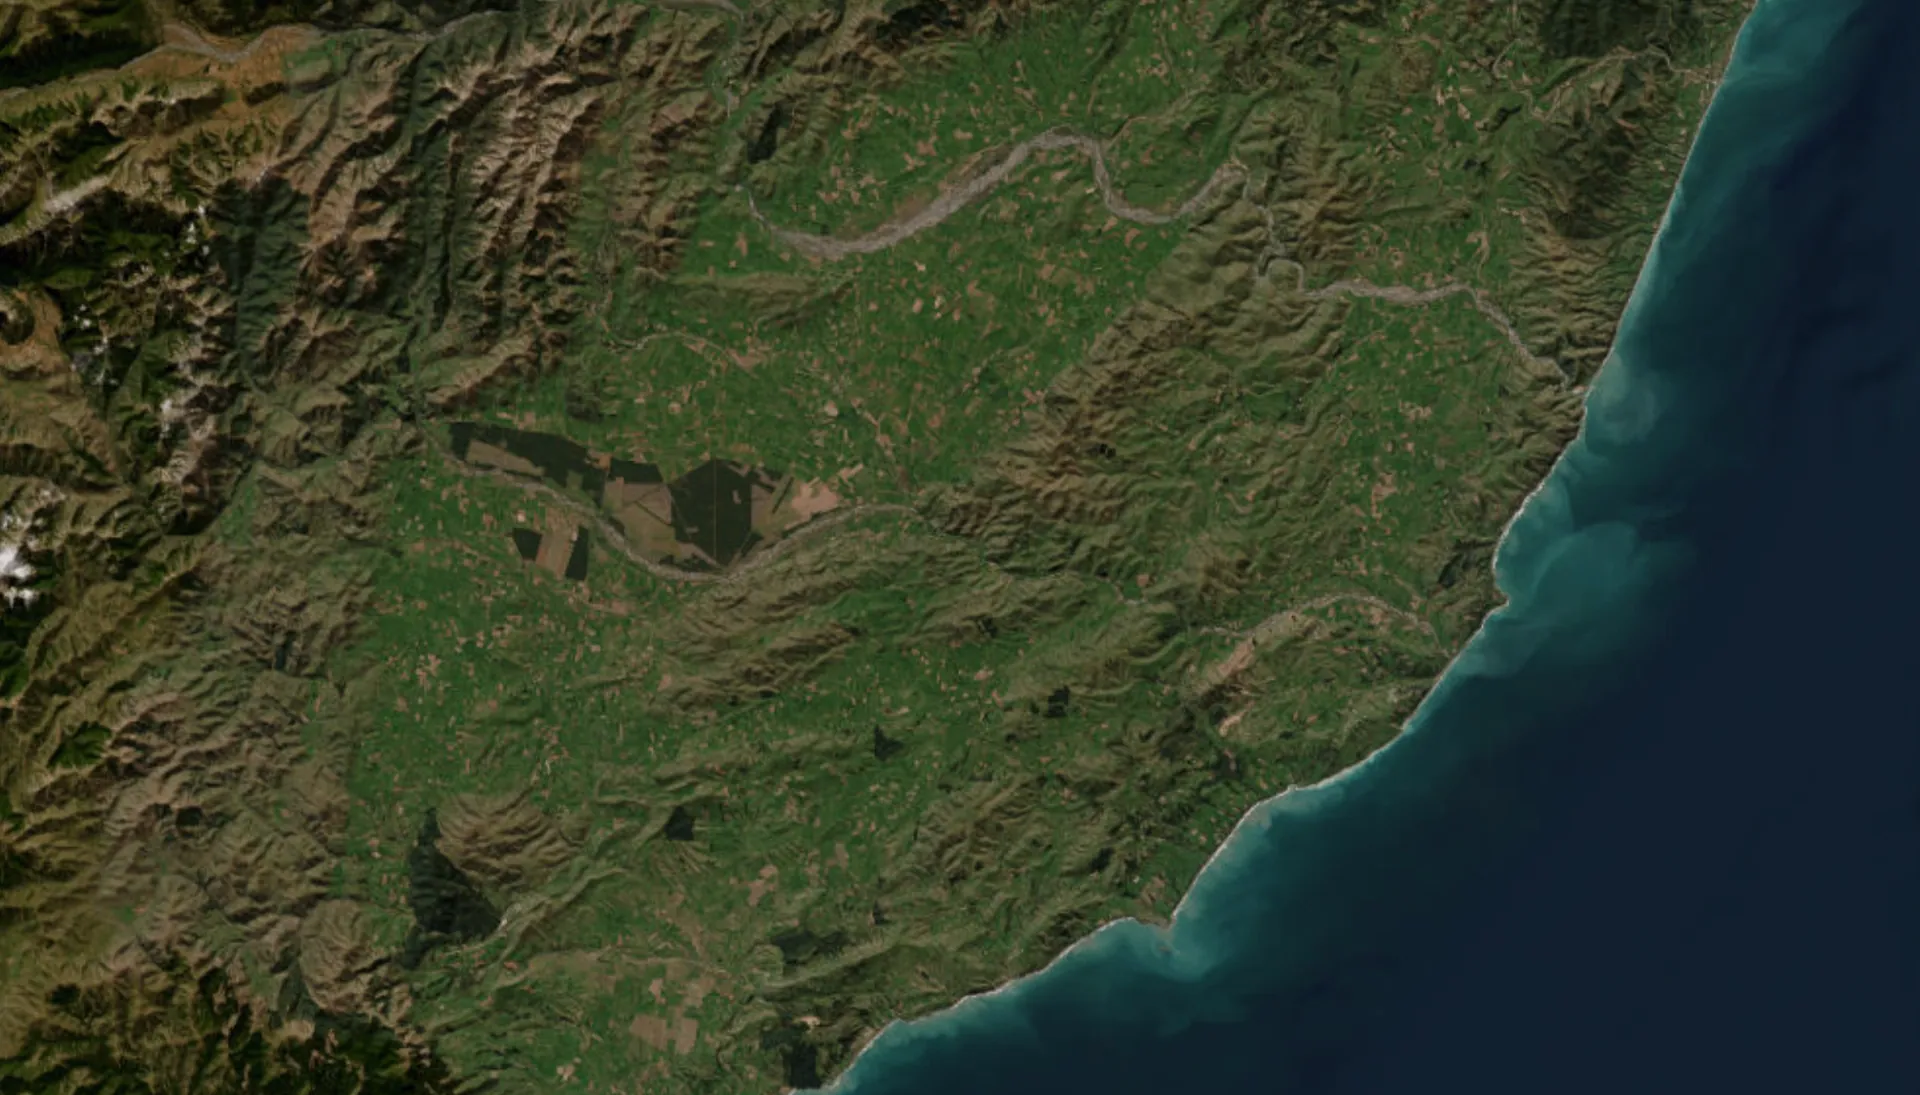
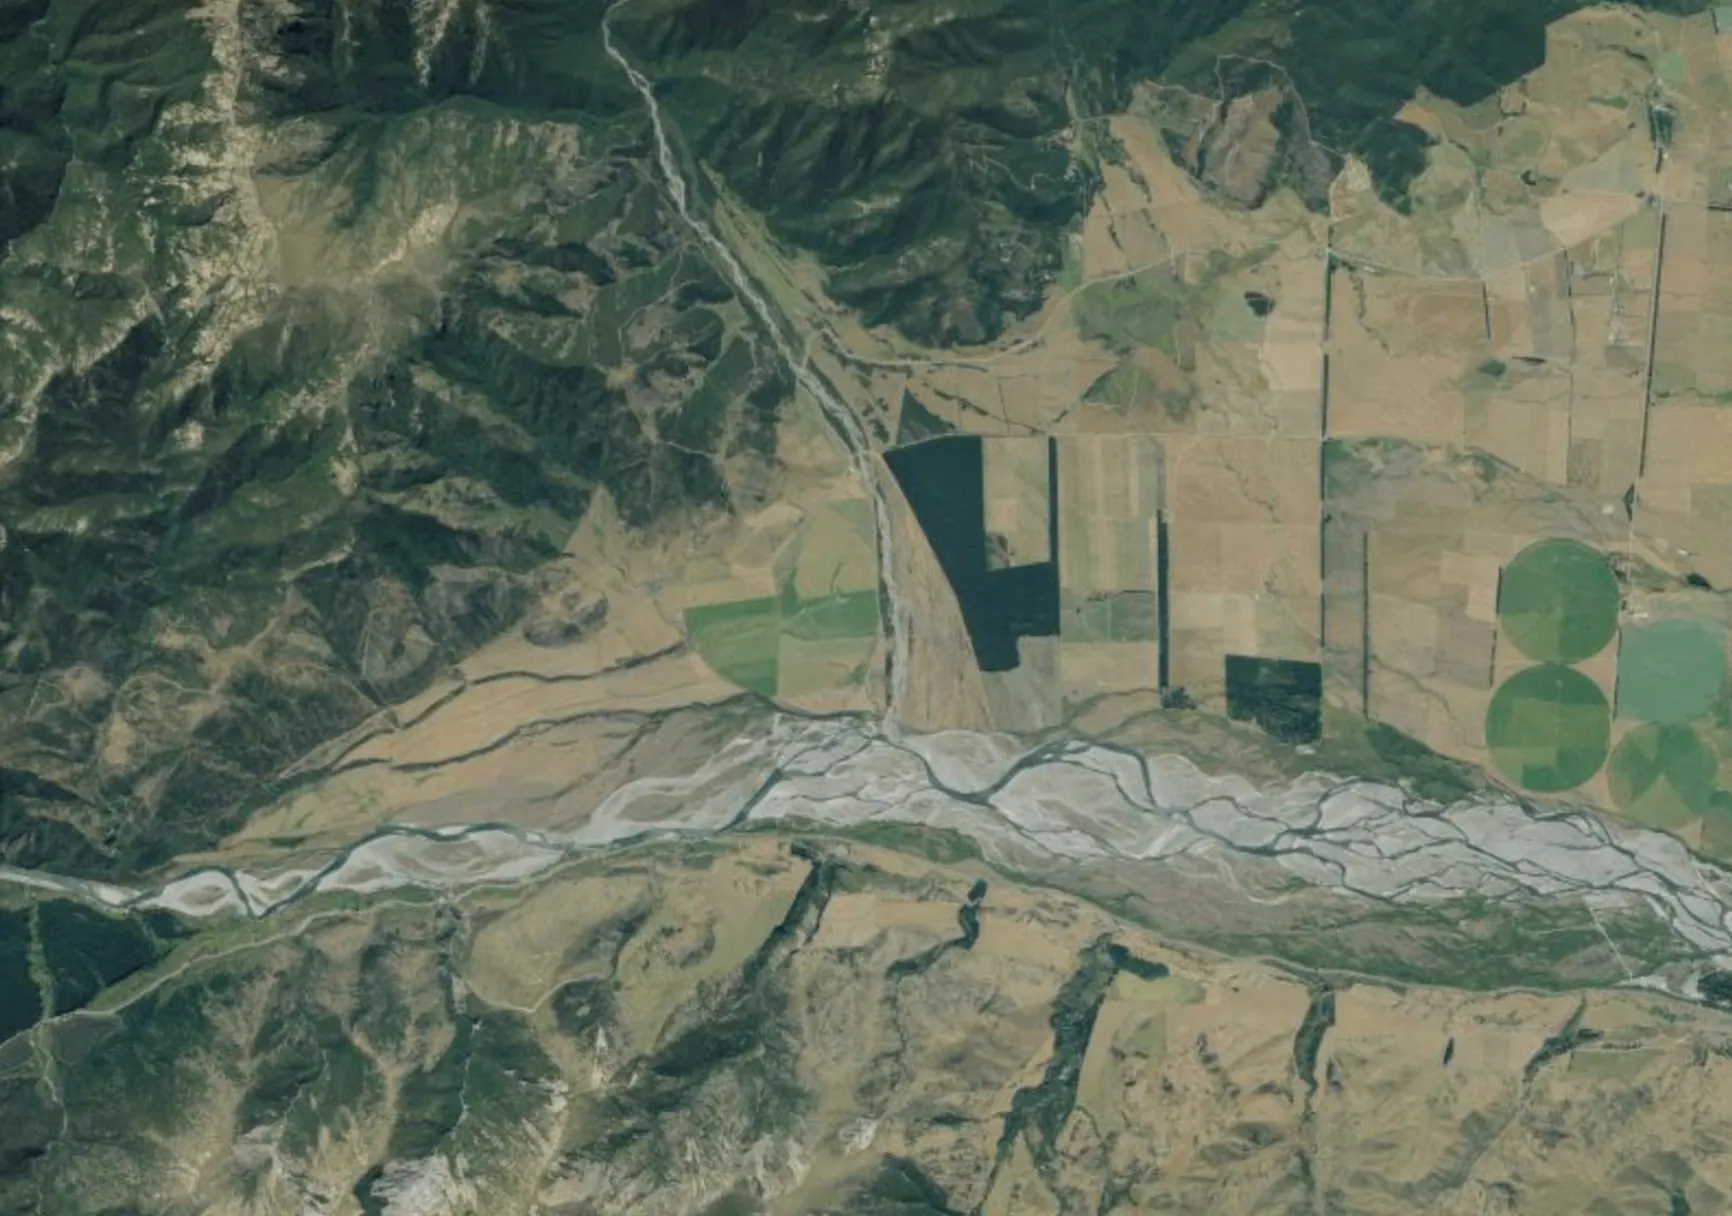
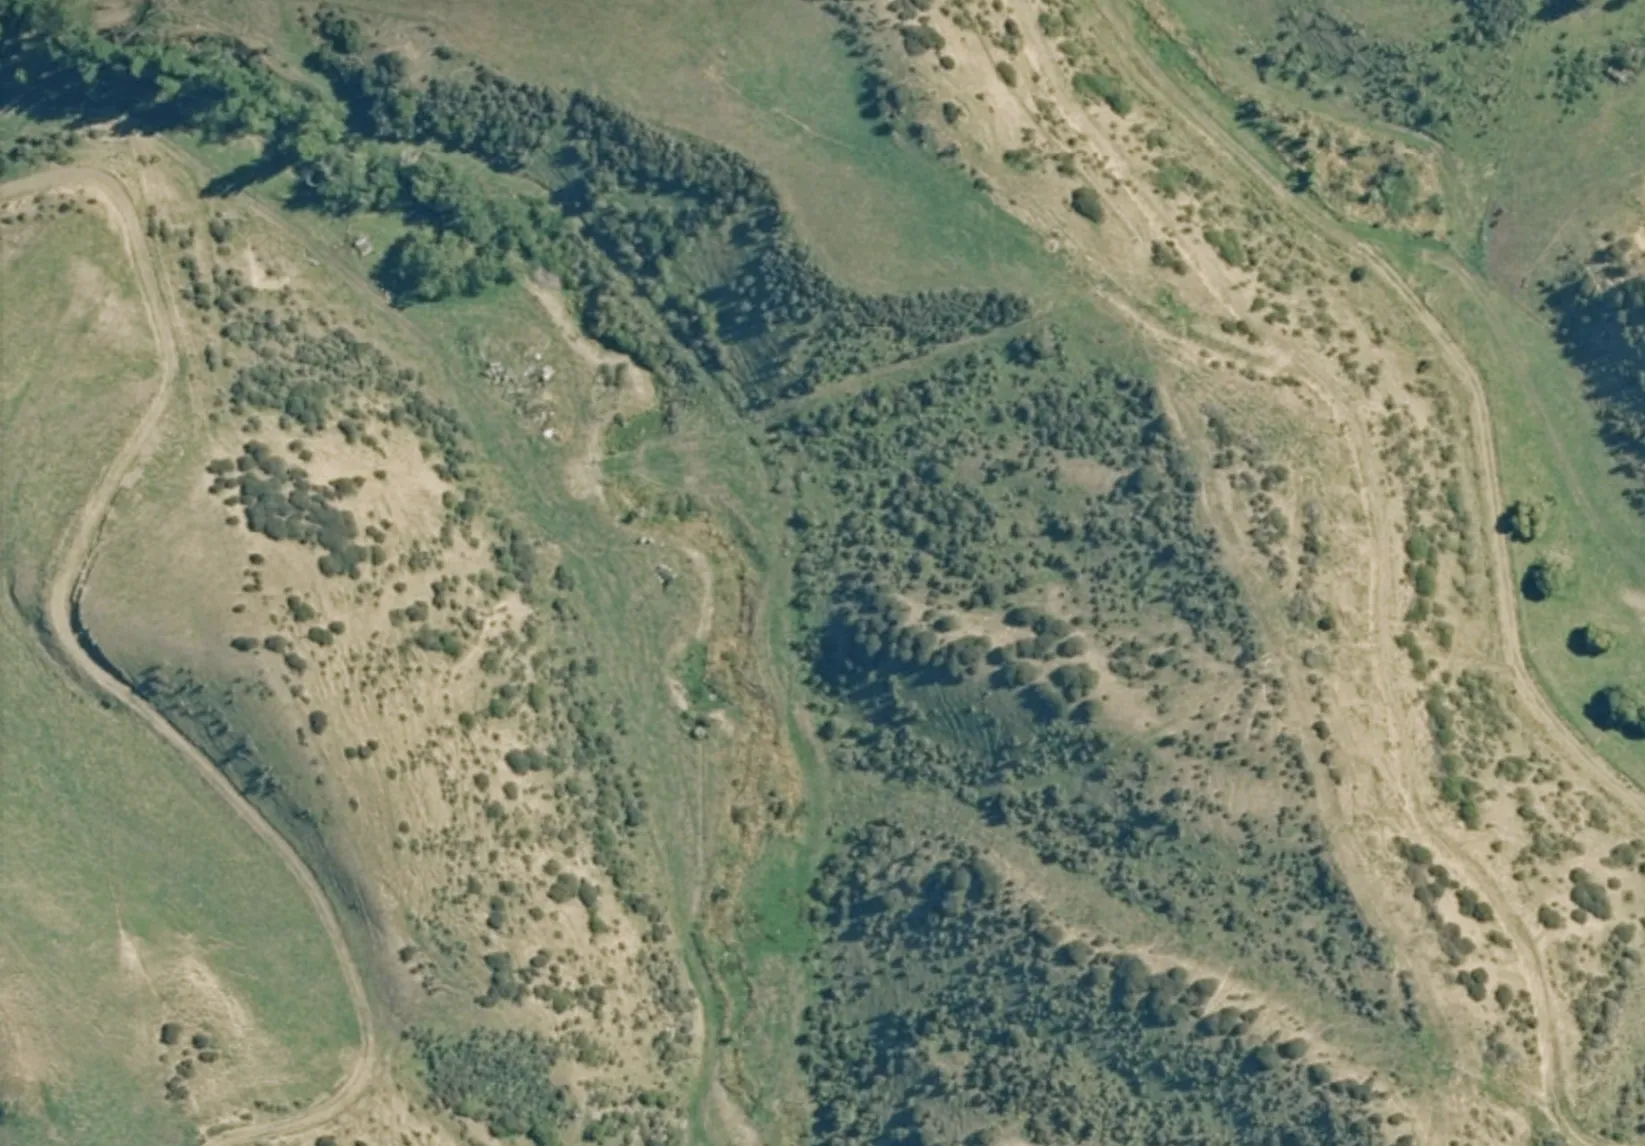

Start with a region.
Zoom into a site.
The closer you look,
the more the landscape reveals.
Problem 1
Your supplier program wasn't built to see the landscape.
Your supplier program tells you how a material was produced, and what the supplier chose to report. Neither was designed to tell you what the landscape it came from is actually doing — whether the forest is intact, whether the watershed is under stress, whether the surrounding land is changing.
Archaster reads the landscape itself: satellite, water, forest, and species data neither you nor your supplier produced. It doesn't replace your certifications or your questionnaires. It tells you what to ask, and what to look at between audits.
Problem 2
Open nature data isn't the same as accessible nature data.
Sentinel-2 satellites pass every five days. NASA monitors live fires, and deforestation monitoring is near-real-time. JRC has forty years of surface water history. The signal is rich, peer-reviewed, and open-source. Reading it together — for a specific decision, in a specific landscape — is geospatial engineering work most teams don't have or can't access fast enough to matter.
Archaster is the layer between open nature data and the people making decisions about landscapes. Without requiring geospatial expertise. Without losing scientific defensibility.
Capabilities
Where nature data meets business decisions
Every capability is designed to move you from data to decision. Whenever you need it, grounded in science. Our decision-grade environmental intelligence is made for sourcing, sustainability, and design teams. Built for people who make decisions about landscapes, without needing a background in satellite or spatial data — point at a location, upload the files you already have, or search a region.
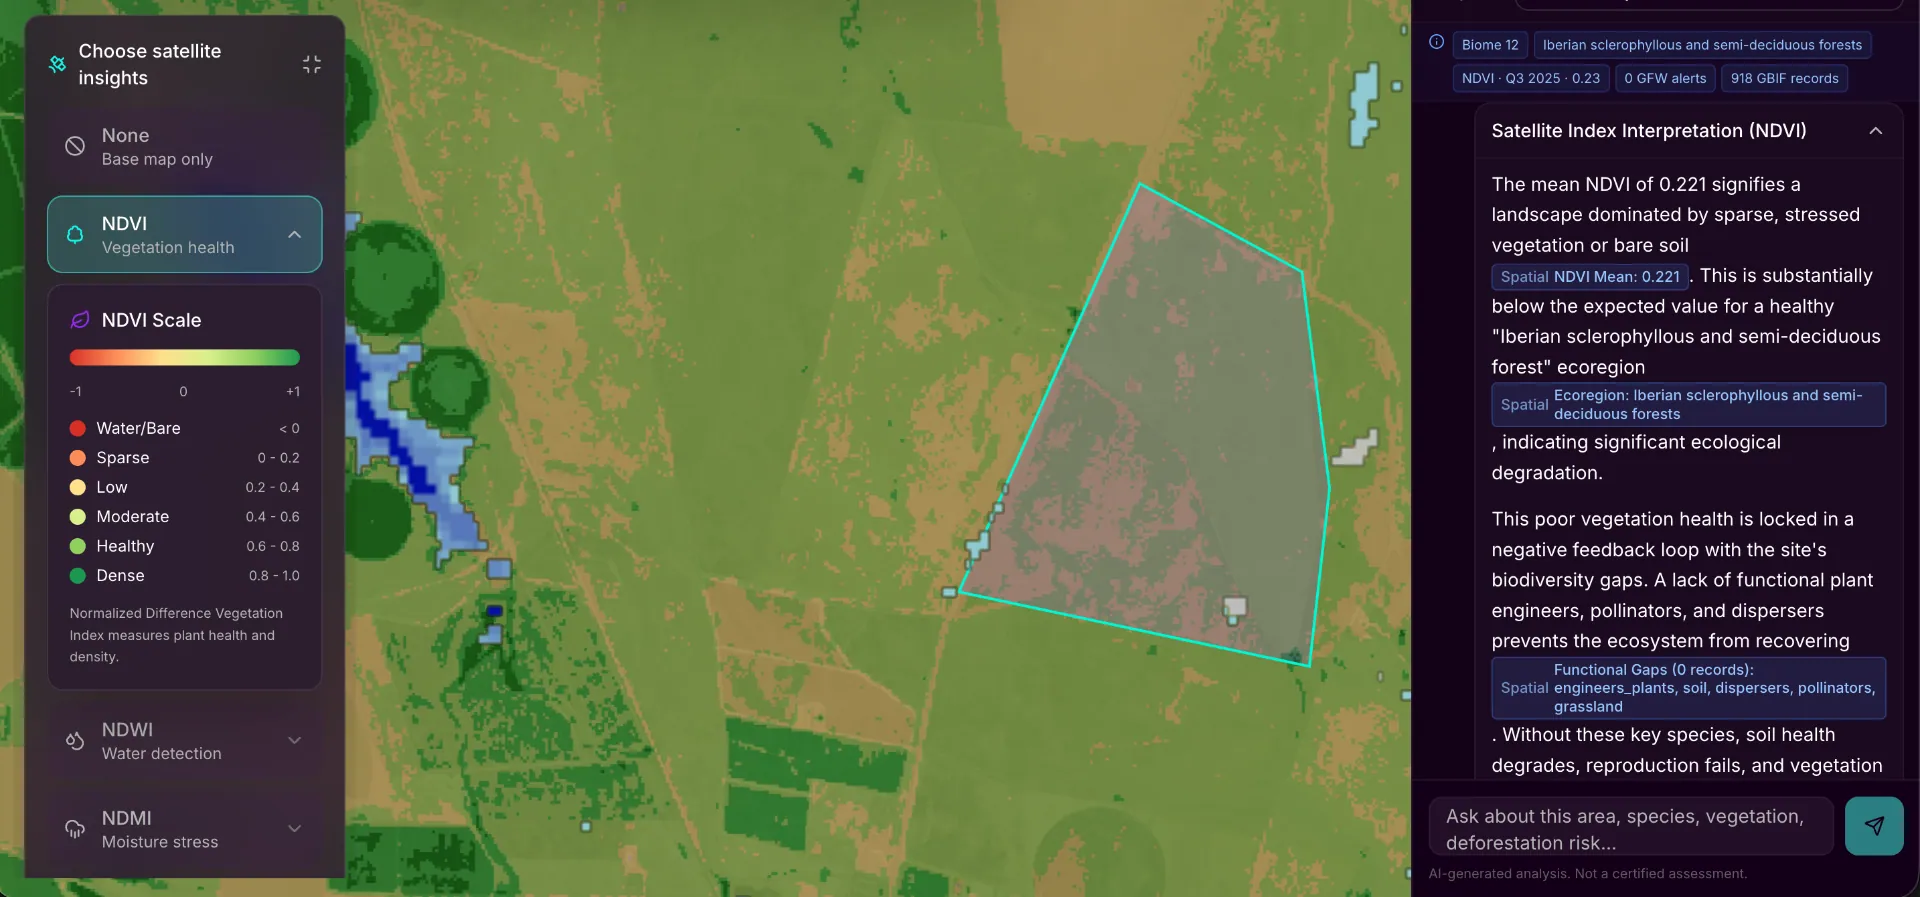
Land Health at a Glance
Understand vegetation health, moisture, and burn risk across your sourcing regions – without touching a spreadsheet.
Biodiversity Insights
The pollinators, predators, and soil organisms in your sourcing regions are the foundations in your supply chain. Start understanding who's there, what they need, and what their presence or absence tells you.
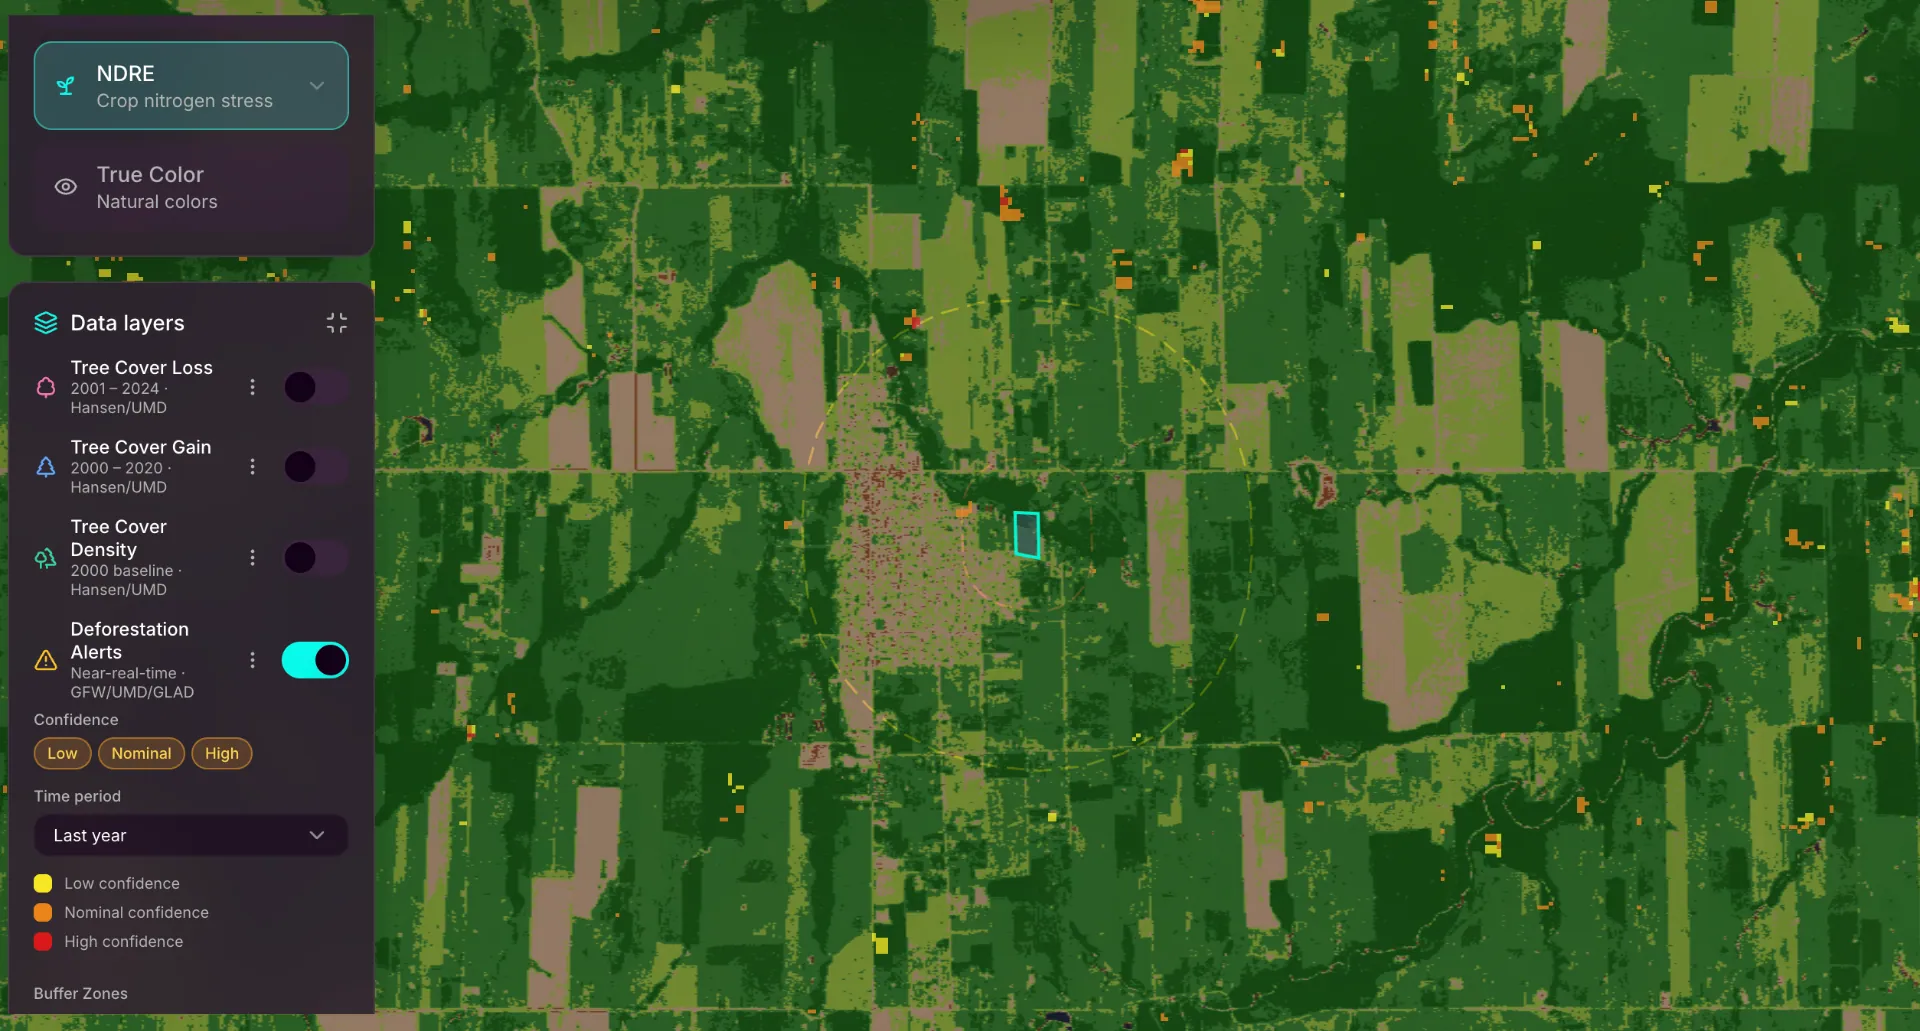
Deforestation Monitoring
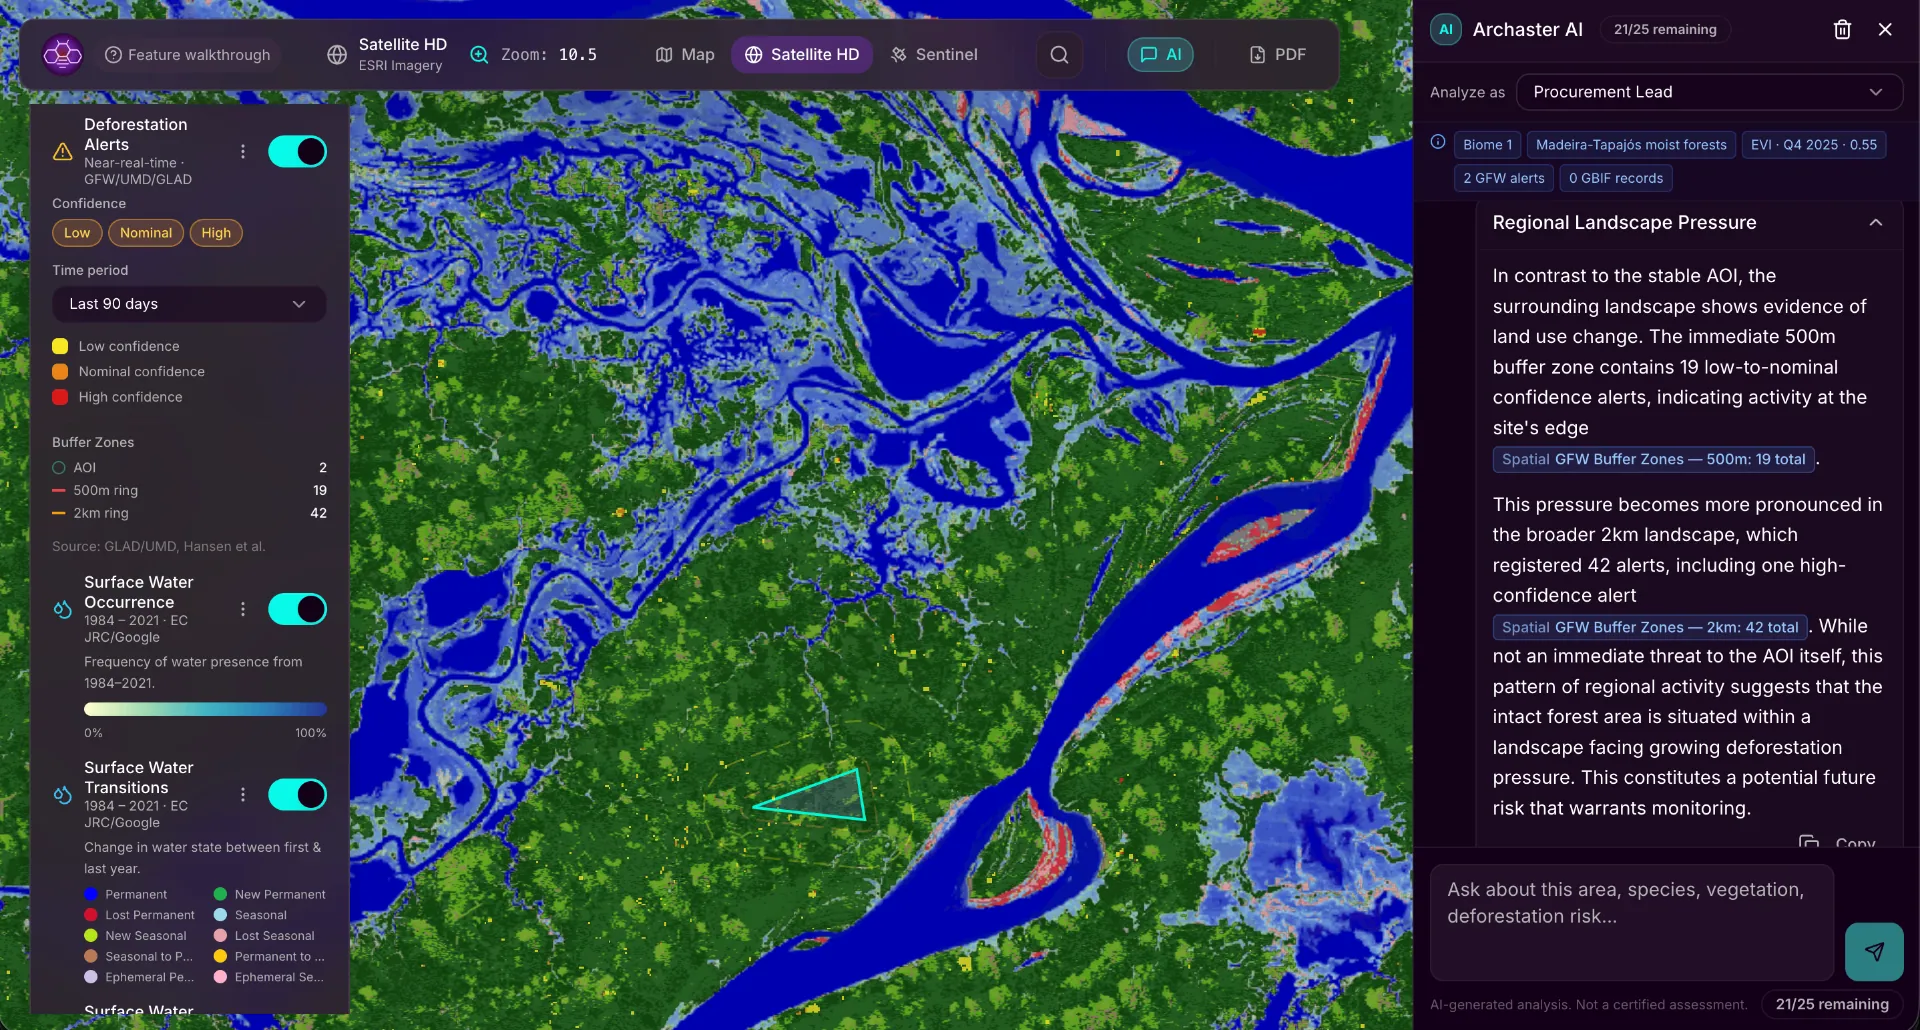
Near-real-time deforestation data when you check your locations or supply chain regions. Buffer zone analysis reveals what site-level data alone cannot: a sourcing site with two alerts inside its boundary and forty-two in the surrounding two kilometres is not the same as a site with no alerts at all. One is stable. The other is intact today. There is a difference between 'this supplier is fine' and 'this supplier is fine today.' Buffer zone analysis is how you know which one you're looking at.
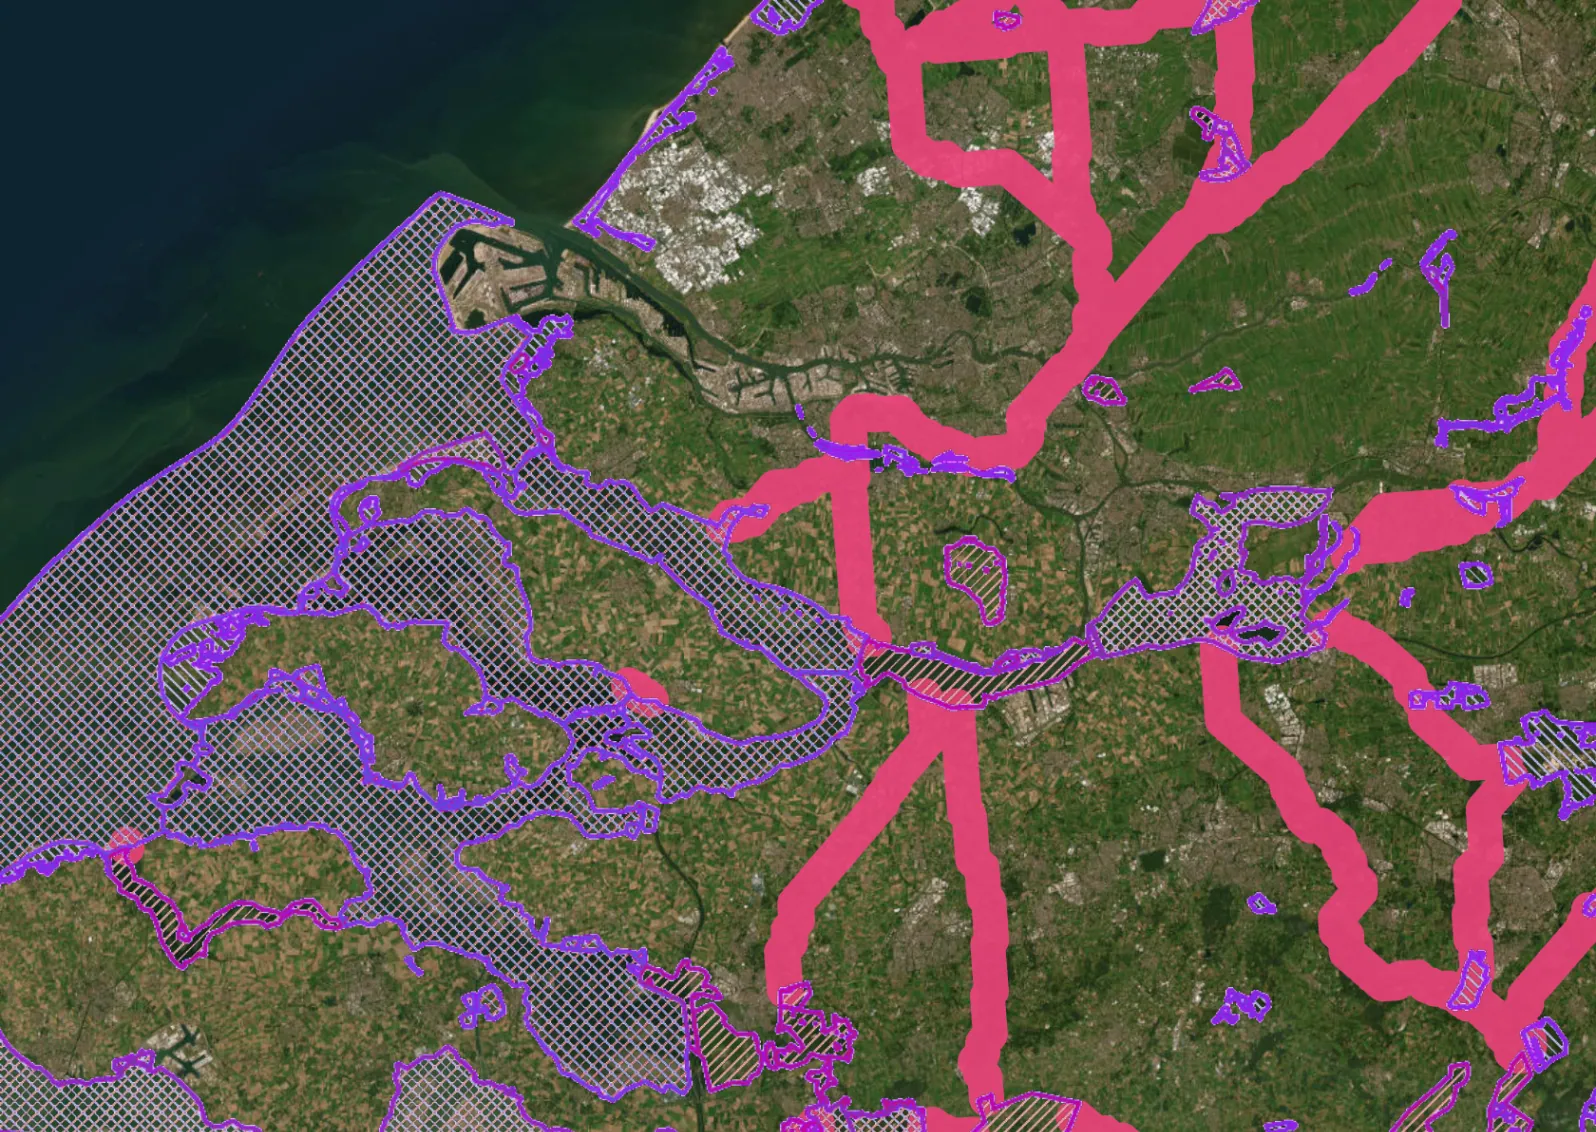
Protected & Sensitive Areas
Automatic screening against Natura 2000 sites, potential climate and wildlife corridors, and indigenous territories. Know immediately if your sourcing region overlaps with protected zones or culturally sensitive land, before it shapes a sourcing or restoration decision.
Water Intelligence
40 years of surface water history. Track seasonal patterns, permanent loss, and new water bodies.
| AOI | NDVI | Area |
|---|---|---|
| Farm Alpha | 0.81 | 245 ha |
| Farm Beta | 0.64 | 182 ha |
| Farm Gamma | 0.73 | 310 ha |
Batch Portfolio Analysis
Upload hundreds of supplier polygons. Analyze them all. Export the results.
High deforestation risk detected. 218 alerts within 2 km of the sourcing polygon. Supply chain risk requires immediate supplier engagement.
- • Verify land use history
- • Evaluate incorporating monitoring into contracts
AI Co-pilot
An AI assistant that understands your geospatial context, not just your question. Ask in plain language and get a cited answer back — no spectral bands to decipher, no scripts to write. Grounded in circular economy, regenerative design, and nature-positive frameworks. Think of it as your regenerative co-pilot.
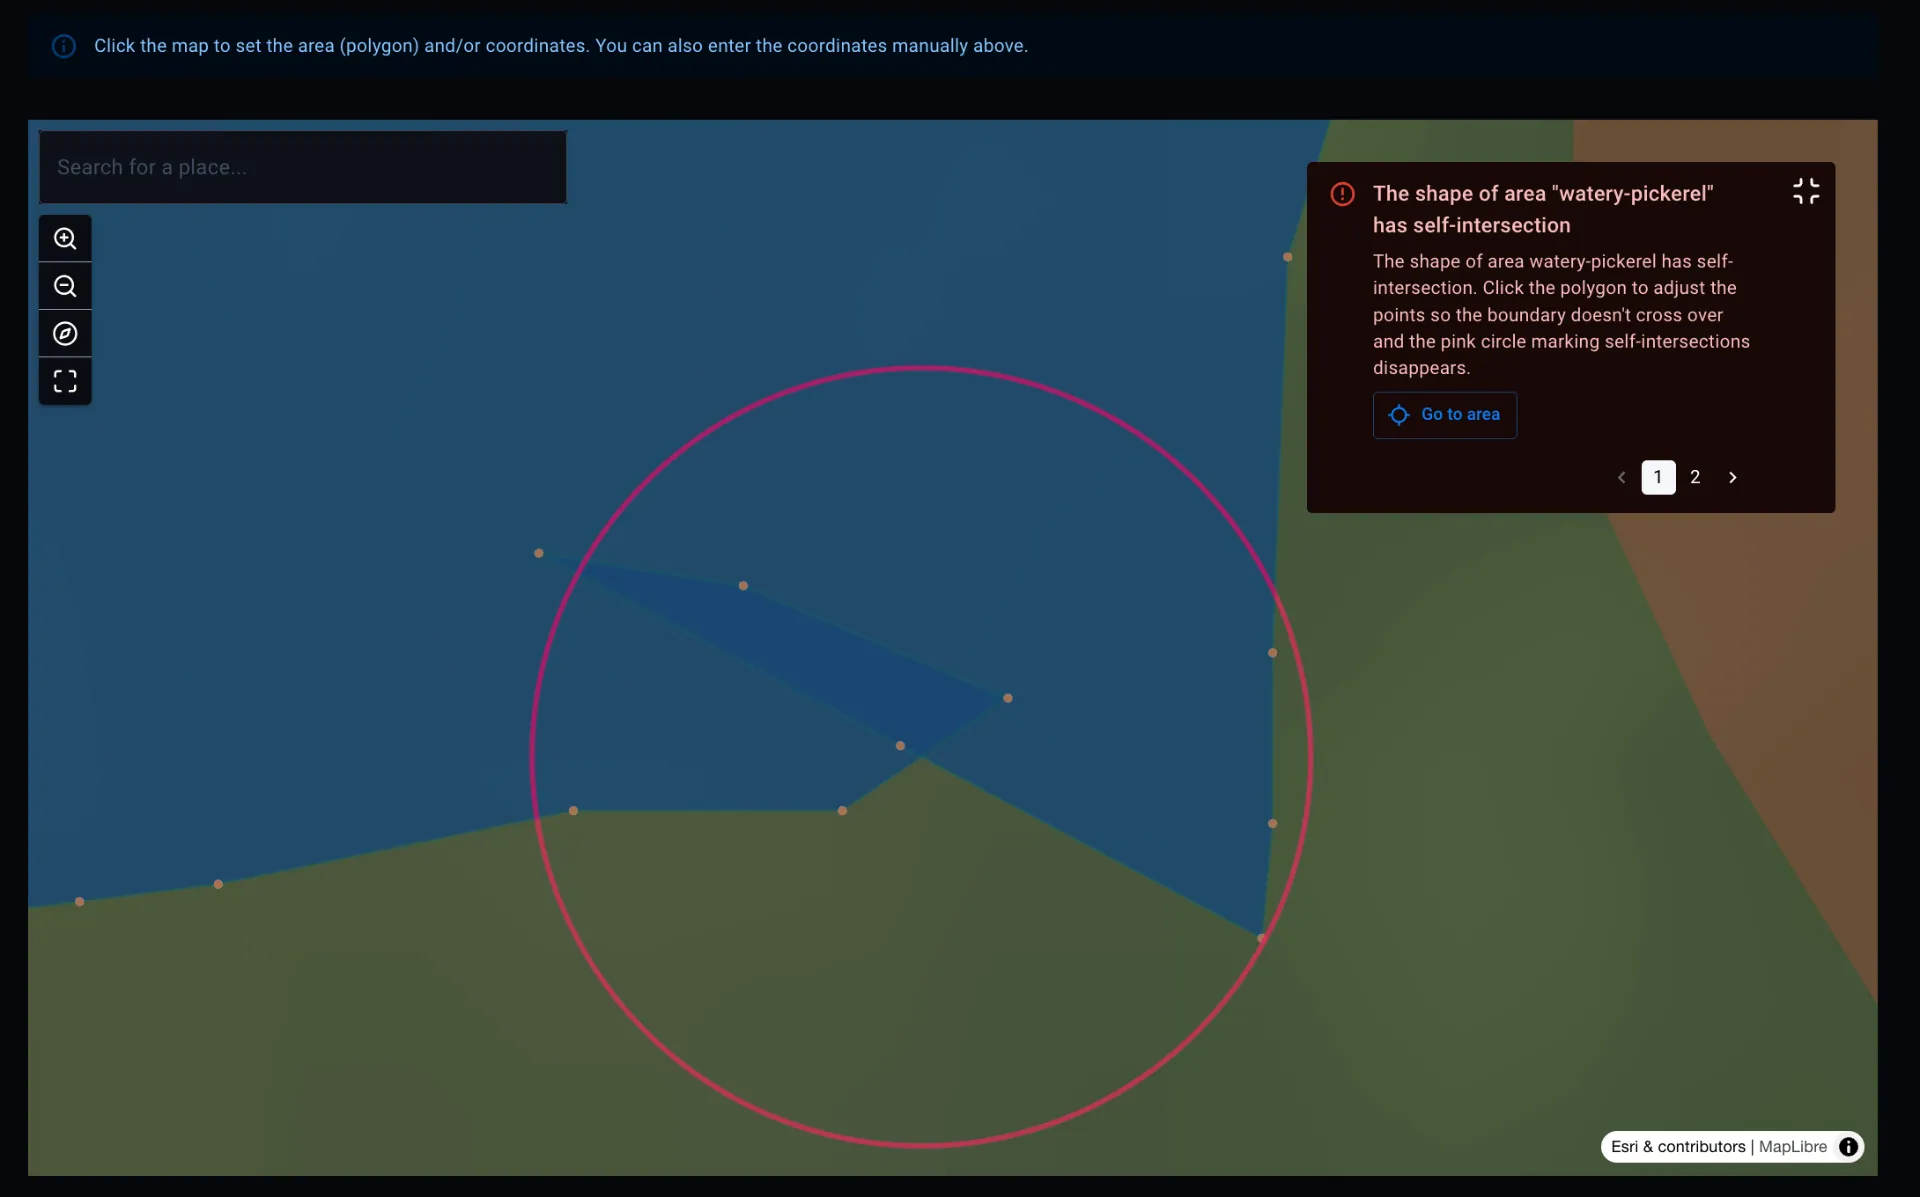
Geometry Validation
Upload your own and supplier polygons and catch issues before they become problems: self-intersections, overlaps, duplicate boundaries. Clean geometry in, reliable analysis out.
In practice
Reading the landscape
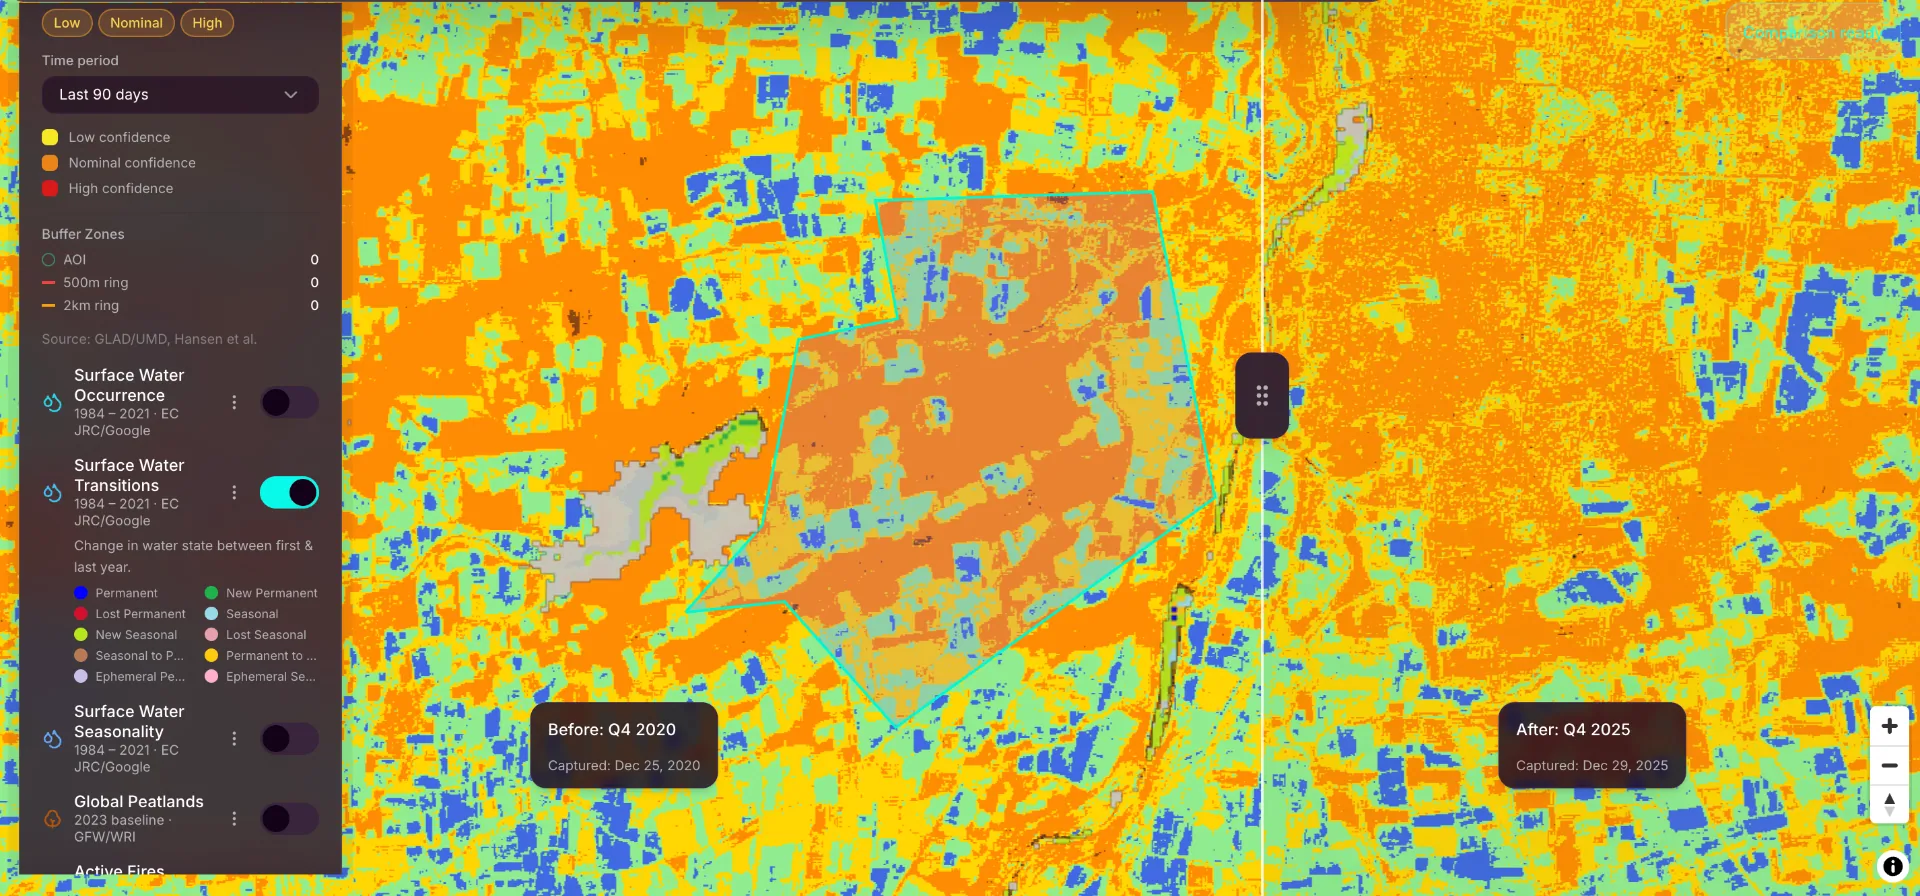
Khargone district, Madhya Pradesh
Cotton67% of surface water changes are new seasonal bodies. In a dry broadleaf forest biome, this signals irrigation infrastructure dependency, not ecosystem recovery.
In a naturally dry region, irrigation dependency is a material risk worth understanding before it appears in your supply chain.
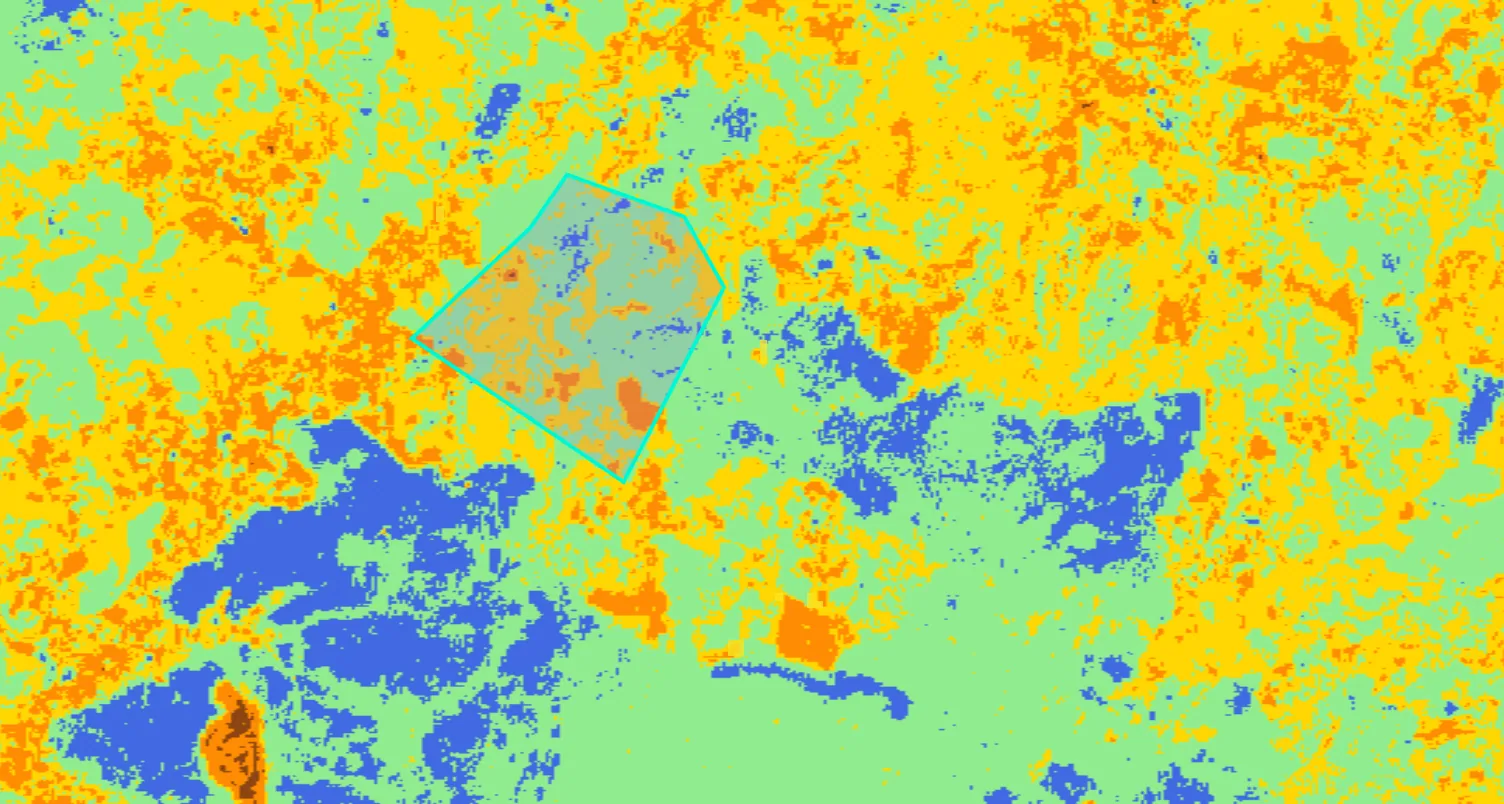
Nuwara Eliya highlands, Sri Lanka
TeaThree findings that reframe how the product story should be told: • No recent deforestation. Dense canopy. Stable land use today. • 43% of surface water is new since 1984. The landscape has changed significantly over four decades. • High moisture variability across the plantation signals a simplified system vulnerable to drought, pest outbreaks, and climate shocks.
The honest story isn't pristine origin. It's we're securing the future of this landscape.
West Africa · Smallholder farms
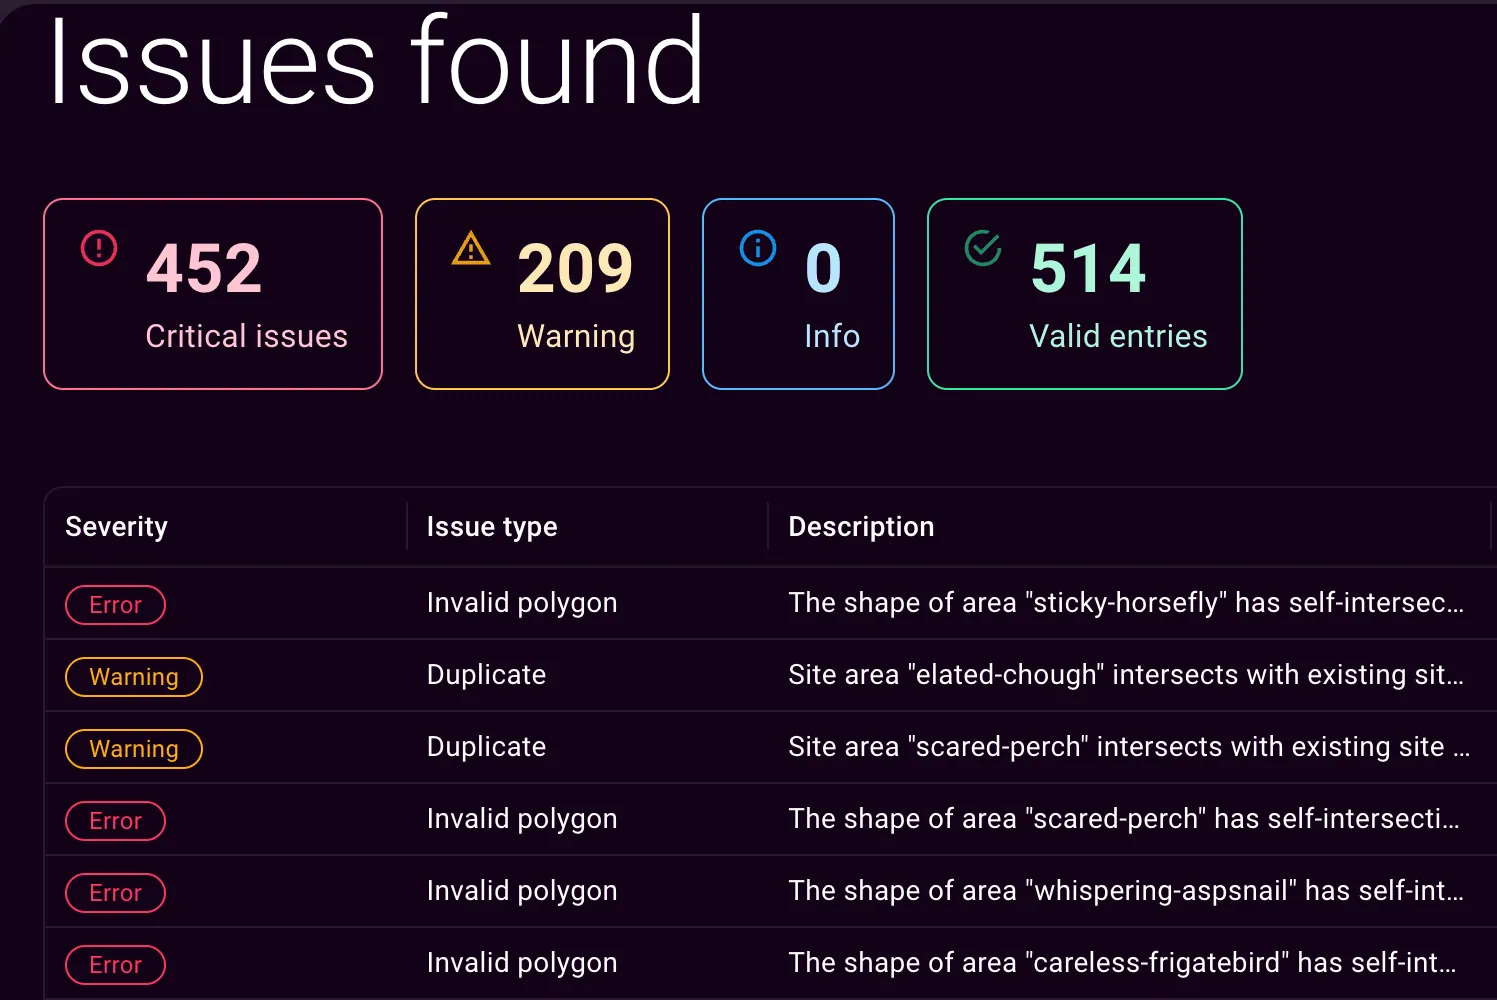
CacaoThe cooperative sent us their farm polygon files — 1,175 plots collected through their traceability programme.
Critical errors were self-intersecting shapes that would fail geospatial analysis outright. Area calculations, buffer zones, and deforestation overlays all depend on valid geometry. Warnings captured duplicates and overlapping site areas that would double-count in downstream analysis.
The full batch validated in 30–40 seconds. Each issue was categorised by severity, linked to its source file, and resolvable inside the platform.
For self-intersections, the map zooms to the exact vertex where the polygon boundary crosses itself and marks it visibly, so the user can drag the point to fix it.
For overlapping polygons, both shapes are shown on satellite imagery side by side, with a note on which came from the imported file, so the cooperative's ops team can decide which to keep.
No GIS expertise needed; no polygons sent back to the field.
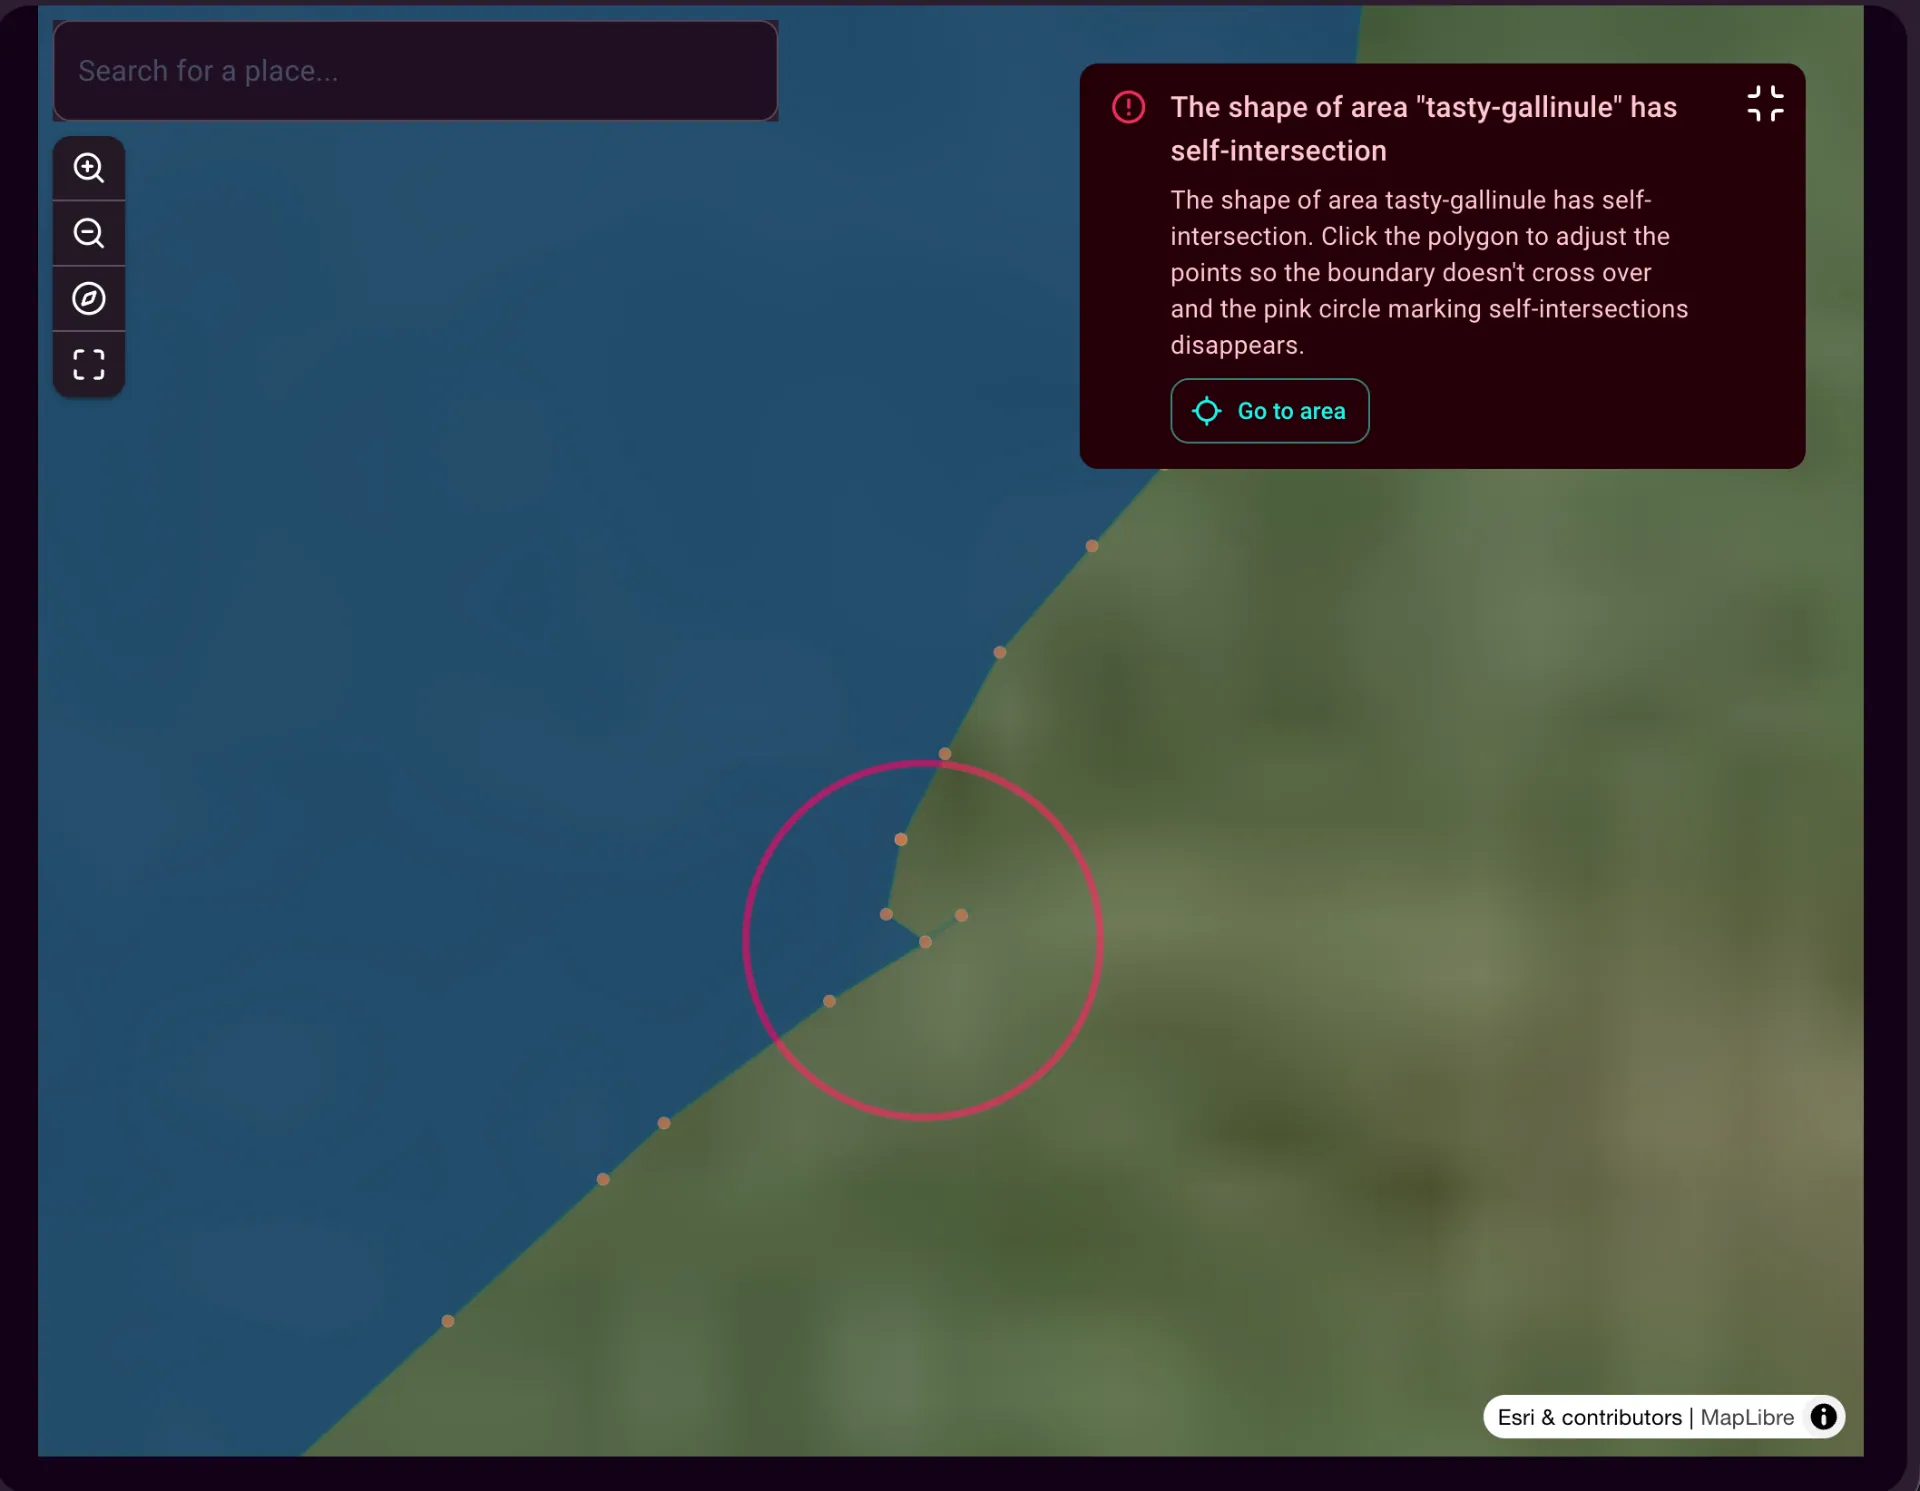
This is the silent failure point in most commodity EUDR programmes. A broken polygon means broken deforestation analysis, broken buffer zones, and Due Diligence Statements that can't be defended. Clean geometry is the precondition for everything else working.
Portfolio
From one site to hundreds.
Monitor your entire sourcing landscape. Track changes across every site, every quarter. Surface the alerts that matter.

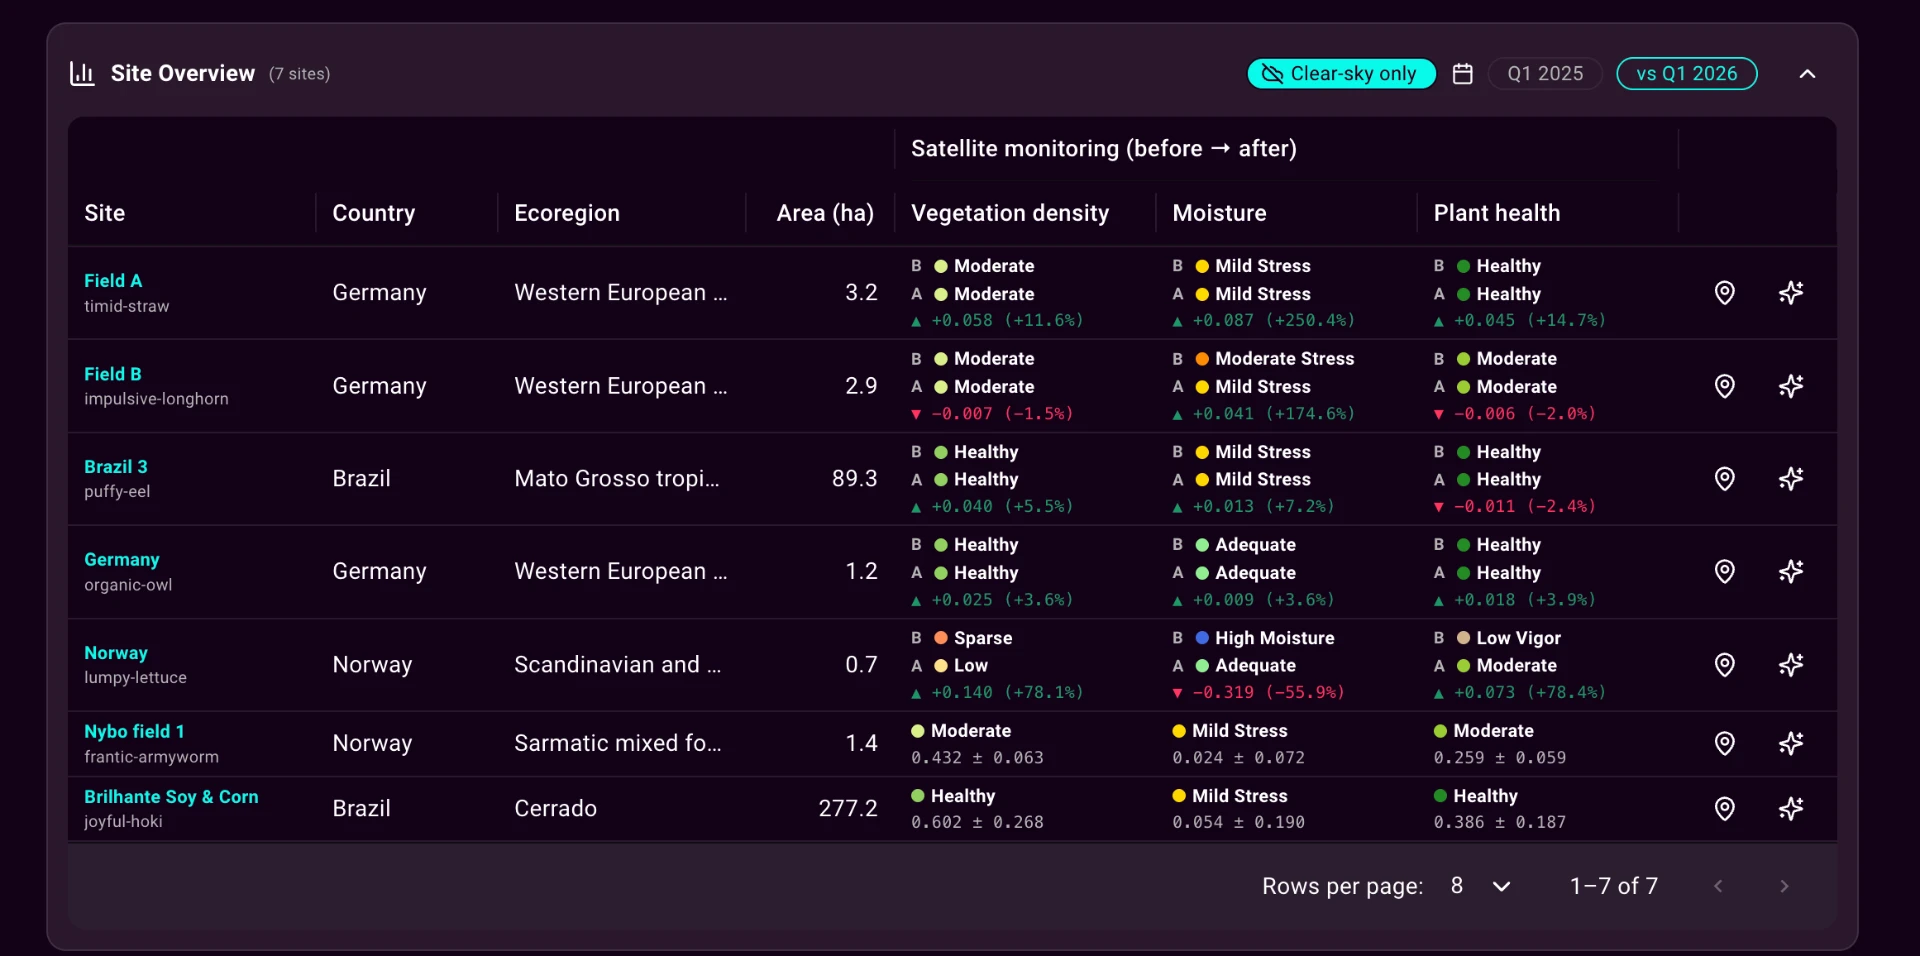
Batch Upload
Already have supplier polygons from a traceability project?
Upload them directly. No redrawing, no GIS setup. Instant ecological analysis across every location you already know.
Drag & drop KML or GeoJSON
Paradigm shift
The old way: a snapshot in time. Disconnected data sources.
The new way: on-demand ecological intelligence. One connected picture.
Early supply signals — from the landscape, before the market feels it.
Vegetation health, moisture stress, and biodiversity data from satellite imagery and species records can surface early indicators of yield pressure, crop stress, and sourcing volatility — before they appear in supplier communications or market prices.
Spectral signals
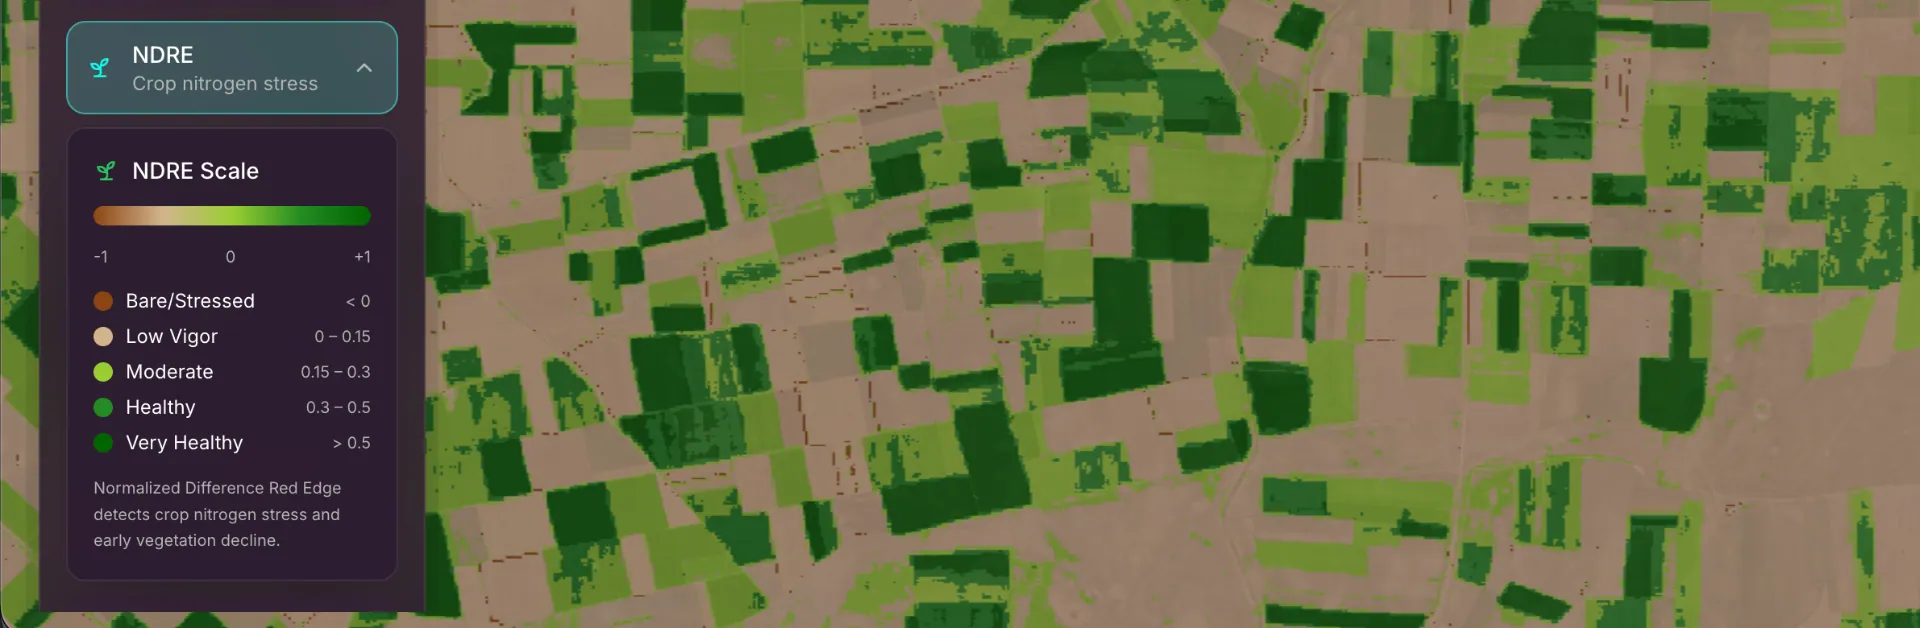
NDVI tracks general vegetation vigor across sourcing regions. EVI performs better in dense canopy or high-biomass areas. NDRE is the most crop-specific index: sensitive to chlorophyll content and nitrogen stress, it can detect early-stage agricultural stress before it becomes visible in broader vegetation readings, making it particularly relevant for teams monitoring specific crop regions. NDMI measures moisture stress in plant tissue, a leading indicator of drought impact on crop quality and yield. NBR detects burn damage that disrupts supply.
Biodiversity as supply signal
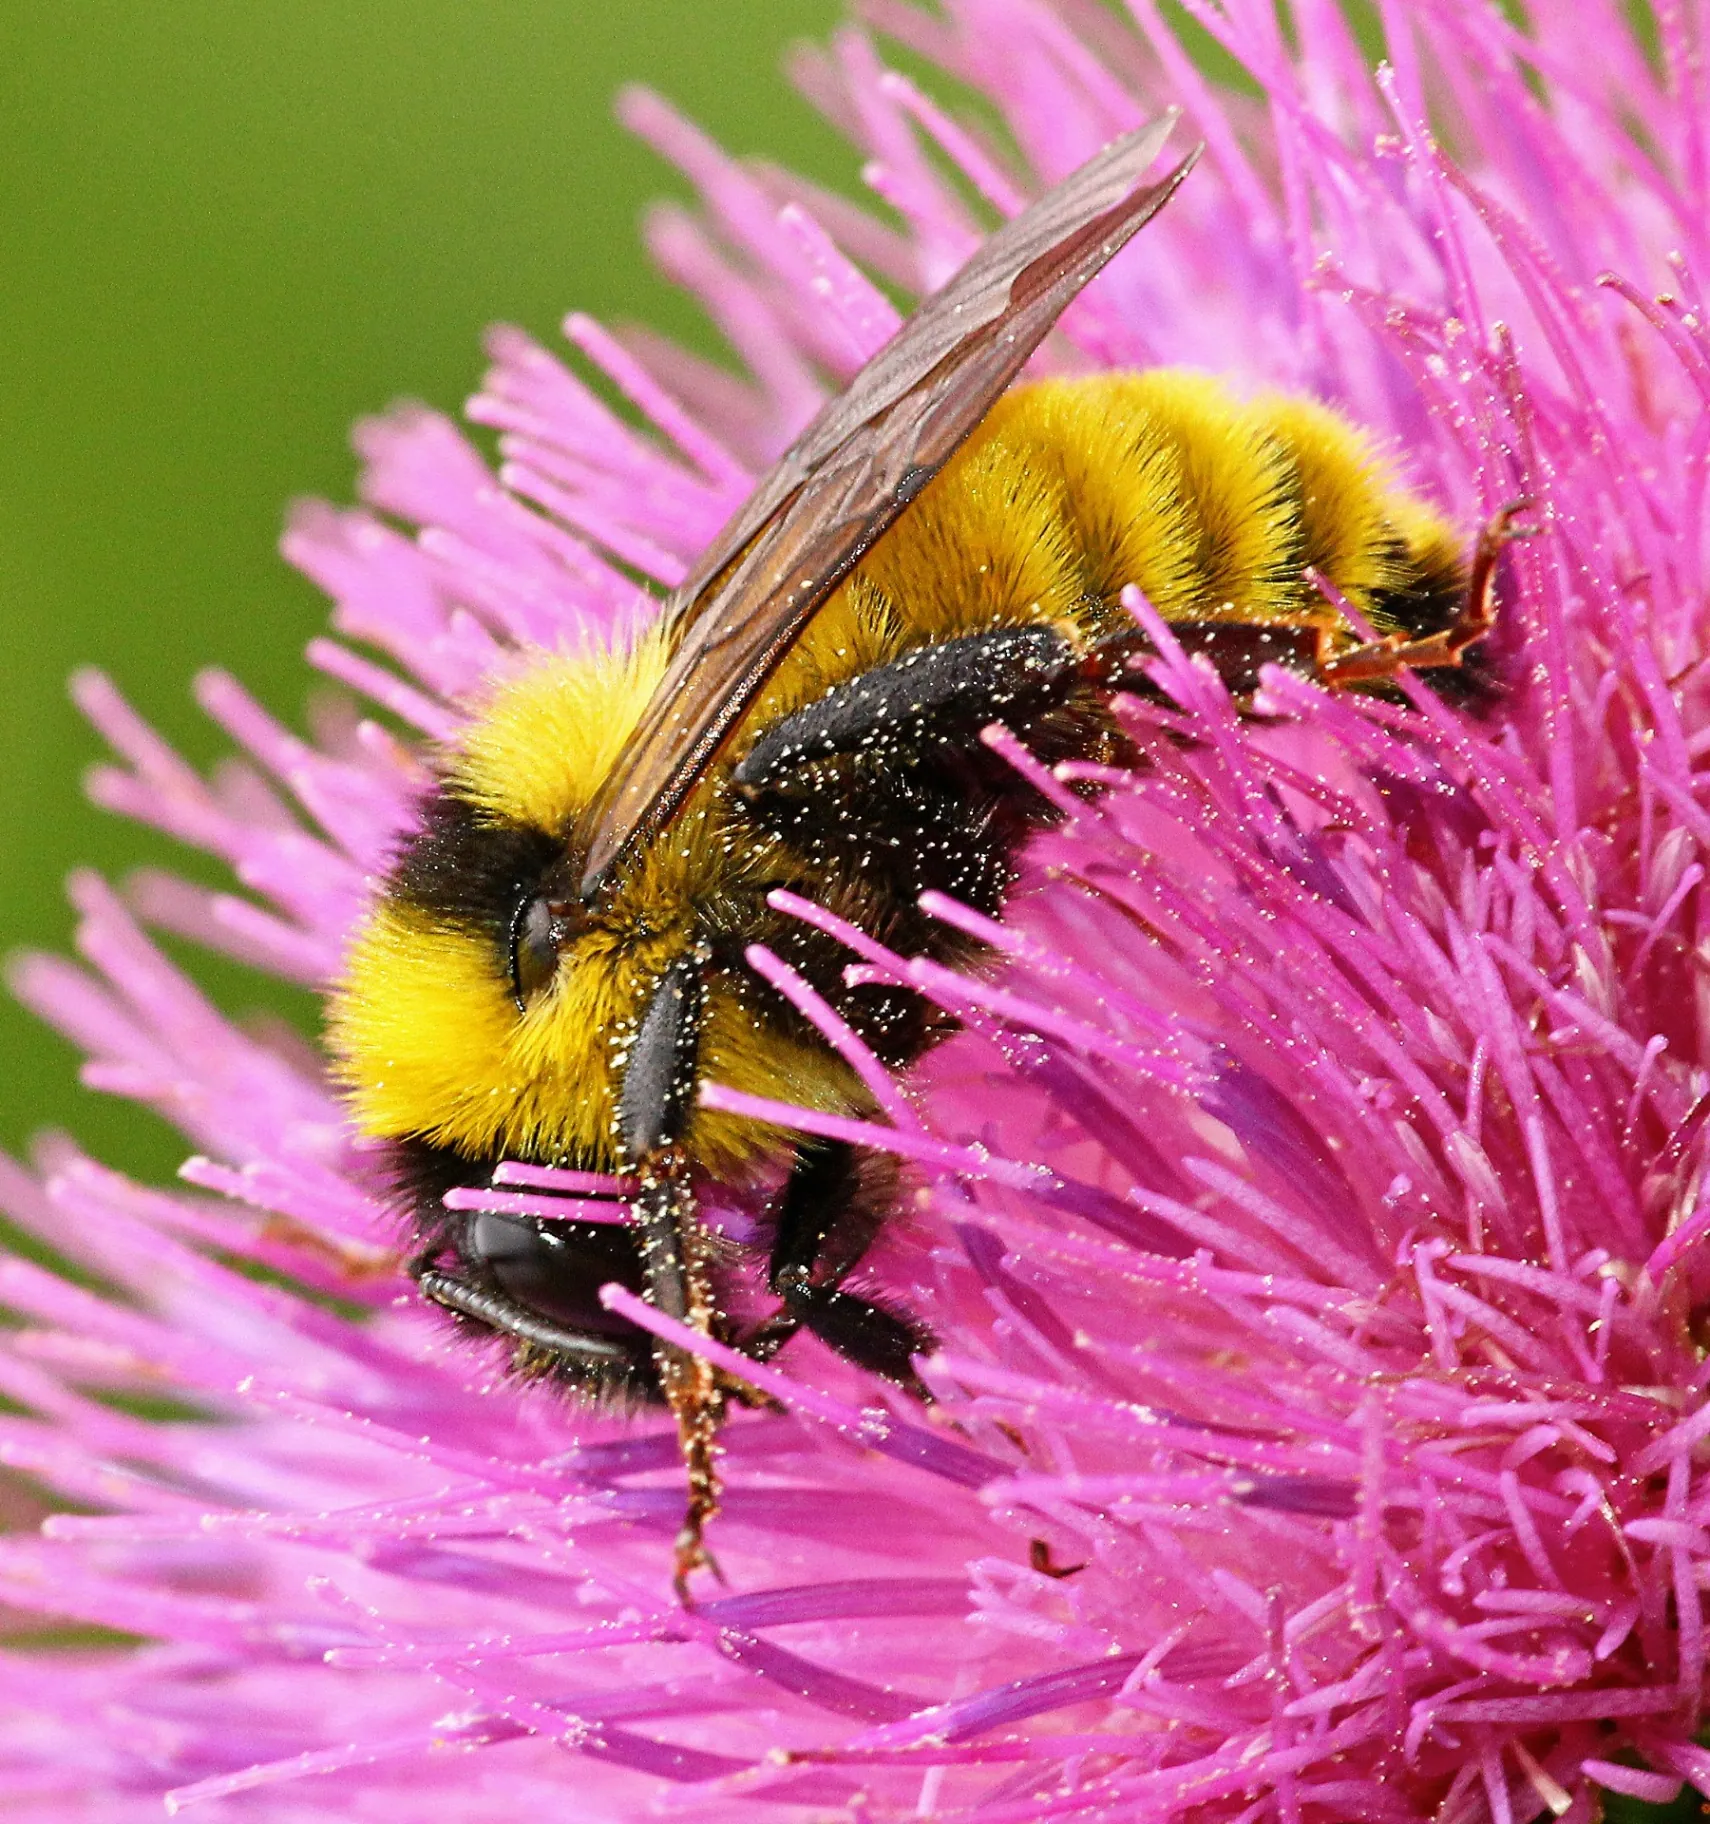
Where GBIF records are dense enough to be reliable, species occurrence data adds another dimension. Many crops depend on specific pollinator species for yield quality and consistency — coffee on native bees, cocoa on midges, many fruits on managed and wild bee populations. Archaster is developing a commodity intelligence layer that connects functional biodiversity data to the specific species and ecological relationships each crop depends on. Where the species those commodities depend on are absent or declining in a sourcing landscape, where there is drought or deforestation, those are supply signals as much as an ecological one.
These indices and species signals don't predict harvests. But patterns of declining vegetation health, increasing moisture stress, or functional biodiversity gaps across your sourcing regions are worth seeing early – before they impact your sourcing.
Ecosystem
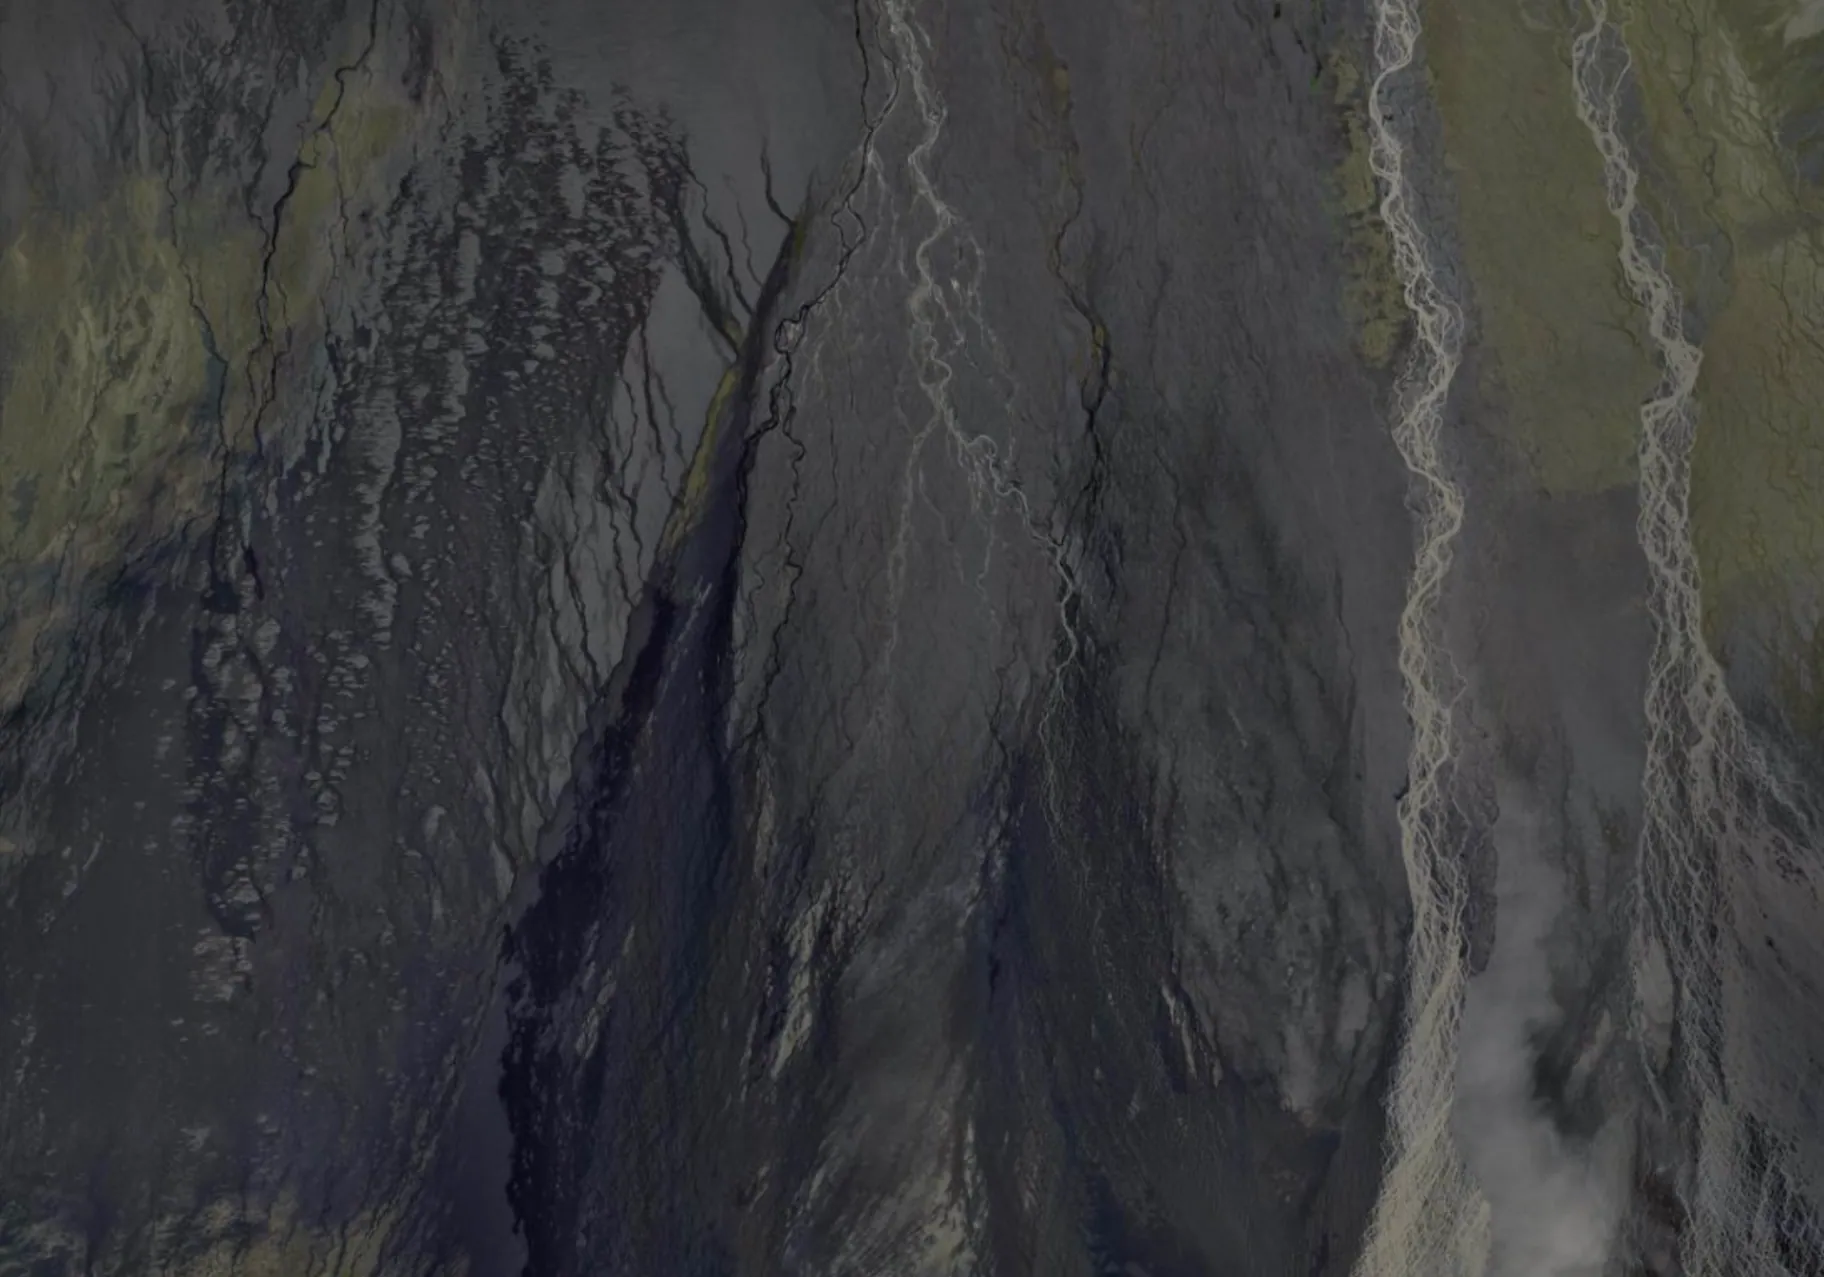
Nature has no borders and gives us a million signals.
Every signal is a story—of forests retreating or recovering, water shifting or returning, species disappearing or finding refuge. Archaster reads them together, because nature doesn't draw lines between them.
Archaster
Intelligence
Built on authoritative data sources
Every dataset is peer-reviewed, openly licensed, and maintained by leading research institutions.













Vision
The next frontier isn't sustainability. It's regeneration, resilience, and reciprocity.
A world where every sourcing decision is made with full awareness of its landscape consequences, and where that awareness drives not just harm reduction but active restoration of the living systems we all depend on.